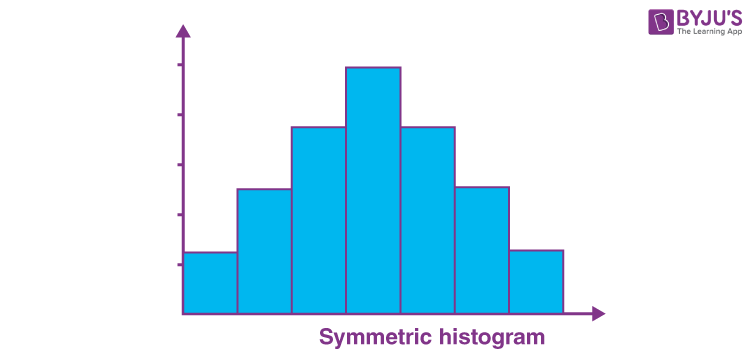
Have you ever stared at a data visualization and wondered about the story it tells? A histogram, with its bars rising and falling like city skylines, can reveal much about the underlying data. But imagine a histogram so perfectly balanced that its mirror image looks identical. This symmetry isn’t just an aesthetic feature; it’s a powerful indicator of data distribution, offering valuable insights into the characteristics of our measurements.

Image:
Let’s delve deeper into the realm of symmetric histograms, exploring their properties, interpreting their meaning, and uncovering their relevance in various fields. This journey will unveil the hidden beauty and insights contained within these balanced data representations.
Understanding Symmetric Histograms
At its core, a histogram is a visual representation of the distribution of numerical data. It divides the data into bins (ranges of values) and then plots the frequency or count of observations within each bin. A symmetric histogram exhibits a distinctive characteristic: its two halves are mirror images of each other. This implies that the data is distributed evenly around a central point, known as the mean.
Real-World Examples of Symmetric Histograms
Symmetric histograms are not just theoretical constructs; they are frequently encountered in various fields. Here are some real-world examples:
1. Heights of Individuals
The distribution of heights in a large population tends to be symmetric. Most people fall within a certain range, clustering around the average height. A histogram representing this data would exhibit a bell-shaped curve, signifying a symmetrical distribution.

Image: mungfali.com
2. Blood Pressure Readings
In a healthy population, systolic blood pressure readings will often display a symmetric distribution. The majority of individuals will have readings close to the average, and the frequencies of higher and lower readings will be roughly equal.
3. Exam Scores
For exams where students are evenly prepared, the distribution of scores often resembles a symmetric shape. The majority of students score around the average, and there are similar numbers of students who score above and below the average.
Interpreting Symmetric Histograms
Symmetric histograms provide valuable insights into the characteristics of the data they represent:
1. Central Tendency
The central point of a symmetric histogram corresponds to the mean, median, and mode, providing a clear indication of the “center” of the data distribution. This central tendency is a crucial factor in understanding the typical value of the data points.
2. Spread
The spread of a symmetric distribution can be measured using the standard deviation, which represents the average distance of data points from the mean. A wider spread indicates greater variability, while a narrower spread signifies less variability.
3. Outliers
Symmetric histograms are useful for identifying outliers, or data points that lie far from the central tendency. These outliers can be due to errors in measurement or may represent unusual cases that warrant further investigation.
Applications of Symmetric Histograms
Symmetric histograms find applications in various fields, including:
1. Quality Control
In manufacturing, histograms are used to monitor the consistency of production processes. A symmetric histogram indicates that the process is in control and producing products within the desired specifications.
2. Financial Analysis
Financial analysts use histograms to analyze stock prices, returns, and other financial data. Symmetric histograms can help identify trends, assess risk, and make informed investment decisions.
3. Medical Research
Histograms are used in medical research to study the distribution of various biological parameters, such as blood pressure, cholesterol levels, and disease prevalence. A symmetric histogram may indicate a healthy population, while skewed histograms may hint at underlying health issues.
Beyond Symmetry: Understanding Asymmetry
While symmetric histograms are valuable, not all data distributions conform to this perfect balance. Asymmetry, also known as skewness, arises when one side of the distribution is stretched out compared to the other. This can indicate the presence of outliers or a non-uniform distribution of values.
1. Skewness and its Types
Skewness can be either positive or negative:
- Positive Skewness: The tail of the distribution extends towards higher values, indicating that there are more high values than low values.
- Negative Skewness: The tail of the distribution extends towards lower values, indicating that there are more low values than high values.
Significance of Skewness
Understanding the type of skewness in a data distribution is crucial for making informed decisions and avoiding biases in analysis. For example:
1. Mean vs. Median
In a skewed distribution, the mean is often pulled towards the tail of the distribution, making it a less robust measure of central tendency than the median, which is less affected by outliers.
2. Statistical Tests
Many statistical tests assume normality, or a symmetrical bell-shaped distribution. Skewness can violate these assumptions, affecting the validity of test results. Transformations of the data may be needed to address skewness.
Symmetric Histogram
Conclusion
Symmetric histograms are invaluable tools for understanding data distribution and identifying patterns. Their balanced, mirror-like nature signifies a harmonious spread of data points, revealing insights into central tendency, spread, and the presence of outliers. While symmetry is a key property of data, recognizing and handling asymmetry is equally important for accurate analysis and informed decision-making. So, next time you encounter a histogram, take a moment to appreciate the story it tells – even the subtle story of asymmetry can illuminate hidden truths within your data.


